Distribution functions for the Signal Discrimination Model (SDM)
Source:R/distributions.R
SDMdist.RdDensity, distribution function, and random generation for the
Signal Discrimination Model (SDM) Distribution with location mu,
memory strength c, and precision kappa. Currently only a
single activation source is supported.
Usage
dsdm(x, mu = 0, c = 3, kappa = 3.5, log = FALSE, parametrization = "sqrtexp")

psdm(
  q,
  mu = 0,
  c = 3,
  kappa = 3.5,
  lower.tail = TRUE,
  log.p = FALSE,
  lower.bound = -pi,
  parametrization = "sqrtexp"
)

qsdm(
  p,
  mu = 0,
  c = 3,
  kappa = 3.5,
  lower.tail = TRUE,
  log.p = FALSE,
  lower.bound = -pi,
  parametrization = "sqrtexp"
)

rsdm(n, mu = 0, c = 3, kappa = 3.5, parametrization = "sqrtexp")
Arguments
- x
Vector of quantiles
- mu
Vector of location values in radians
- c
Vector of memory strength values
- kappa
Vector of precision values
- log
Logical; if
TRUE, values are returned on the log scale.- parametrization
Character; either
"bessel"or"sqrtexp"(default). See the online article for details on the parameterization.- q
Vector of quantiles
- lower.tail
Logical; If
TRUE(default), return P(X <= x). Else, return P(X > x)- log.p
Logical; if
TRUE, probabilities are returned on the log scale.- lower.bound
Numeric; Lower bound of integration for the cumulative distribution
- p
Vector of probabilities
- n
Number of observations to sample
Value
dsdm gives the density, psdm gives the distribution
function, qsdm gives the quantile function, and rsdm generates
random deviates.
Details
Parametrization
See the online article for details on the parameterization.
Oberauer (2023) introduced the SDM with the bessel parametrization. The
sqrtexp parametrization is the default in the bmm package for
numerical stability and efficiency. The two parametrizations are related by
the functions c_bessel2sqrtexp() and c_sqrtexp2bessel().
The cumulative distribution function
Since responses are on the circle, the cumulative distribution function
requires you to choose a lower bound of integration. The default is
\(-\pi\), as for the brms::pvon_mises() function but you can choose any
value in the argument lower.bound of psdm and qsdm. Another useful
choice is the mean of the response distribution minus \(\pi\), e.g.
lower.bound = mu-pi. This is the default in
circular::pvonmises(), and it ensures that 50% of the cumulative
probability mass is below the mean of the response distribution.
psdm is 0 at lower.bound and 1 at lower.bound + 2 * pi; a q outside
this range is wrapped around the circle. qsdm inverts psdm by root
finding and returns values between lower.bound and lower.bound + 2 * pi.
Values of p outside [0, 1] give NaN with a warning. Missing values
give NA; NaN, infinite values and positions (q, mu, lower.bound)
beyond 1e8 in absolute value give NaN, as does the bessel
parametrization for kappa above 1e5.
References
Oberauer, K. (2023). Measurement models for visual working memory - A factorial model comparison. Psychological Review, 130(3), 841–852
Examples
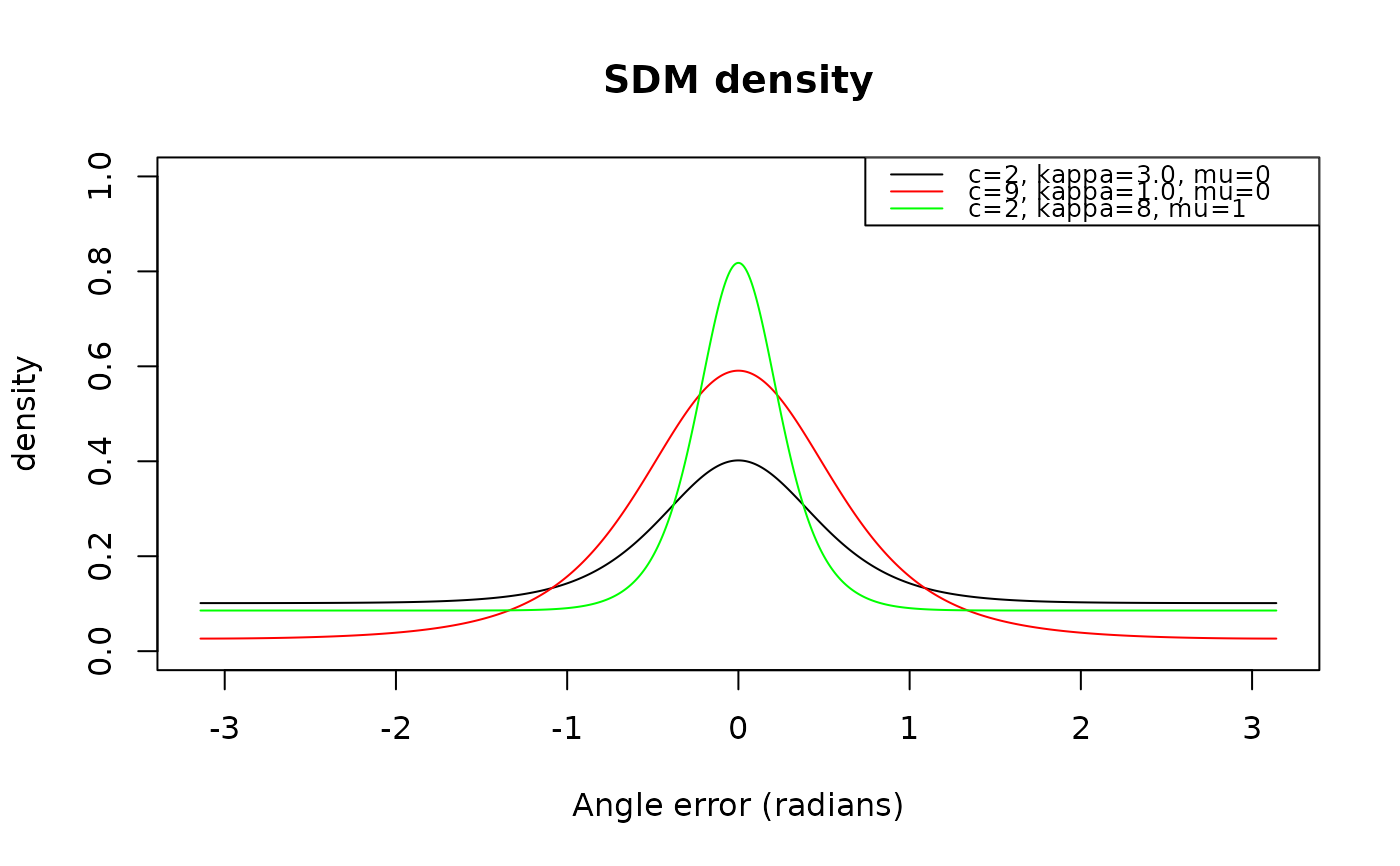
# plot the density of the SDM distribution
x <- seq(-pi, pi, length.out = 10000)
plot(x, dsdm(x, 0, 2, 3),
type = "l", xlim = c(-pi, pi), ylim = c(0, 1),
xlab = "Angle error (radians)",
ylab = "density",
main = "SDM density"
)
lines(x, dsdm(x, 0, 9, 1), col = "red")
lines(x, dsdm(x, 0, 2, 8), col = "green")
legend("topright", c(
"c=2, kappa=3.0, mu=0",
"c=9, kappa=1.0, mu=0",
"c=2, kappa=8, mu=1"
),
col = c("black", "red", "green"), lty = 1, cex = 0.8
)
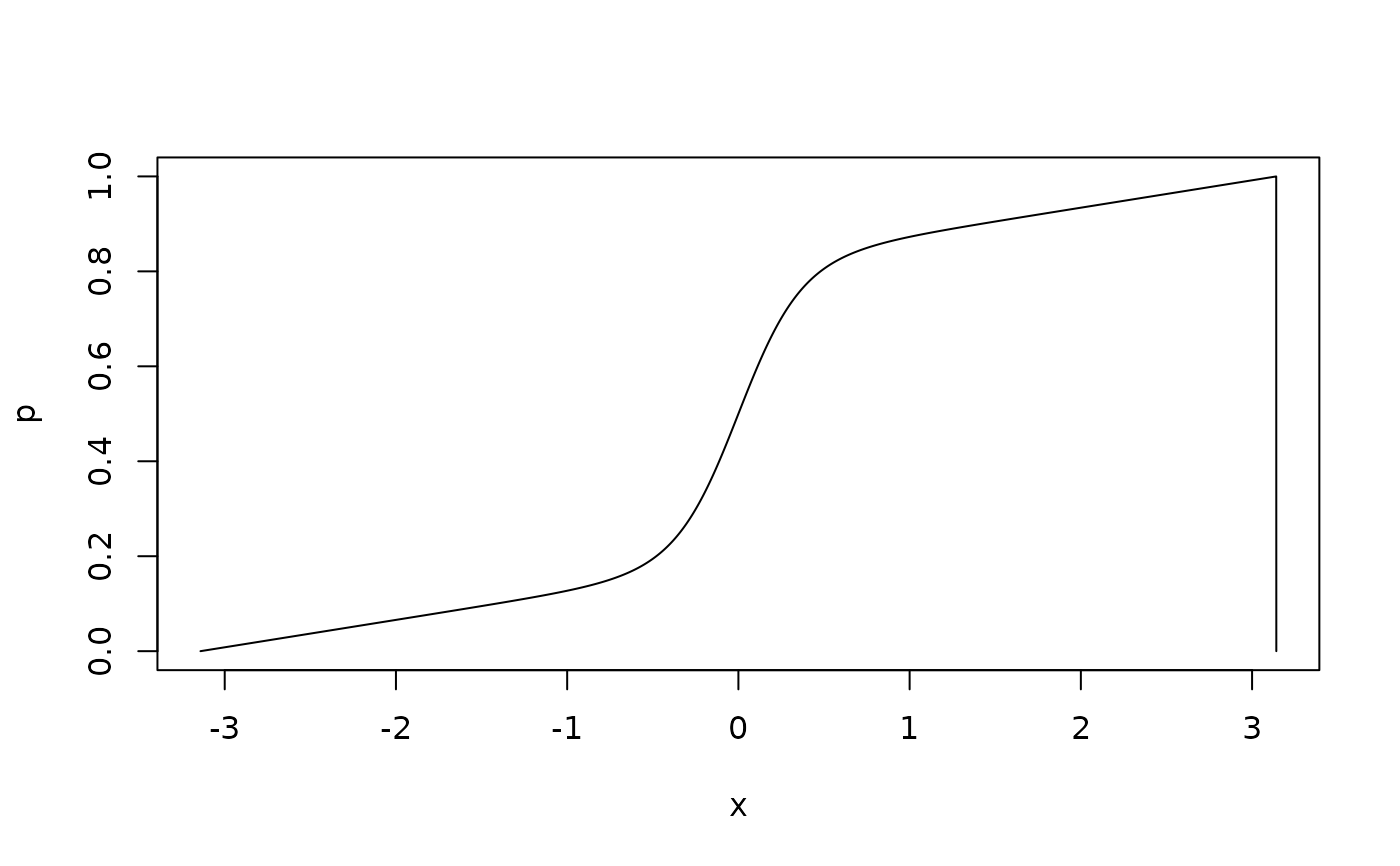
 # plot the cumulative distribution function of the SDM distribution
p <- psdm(x, mu = 0, c = 3.1, kappa = 5)
plot(x, p, type = "l")
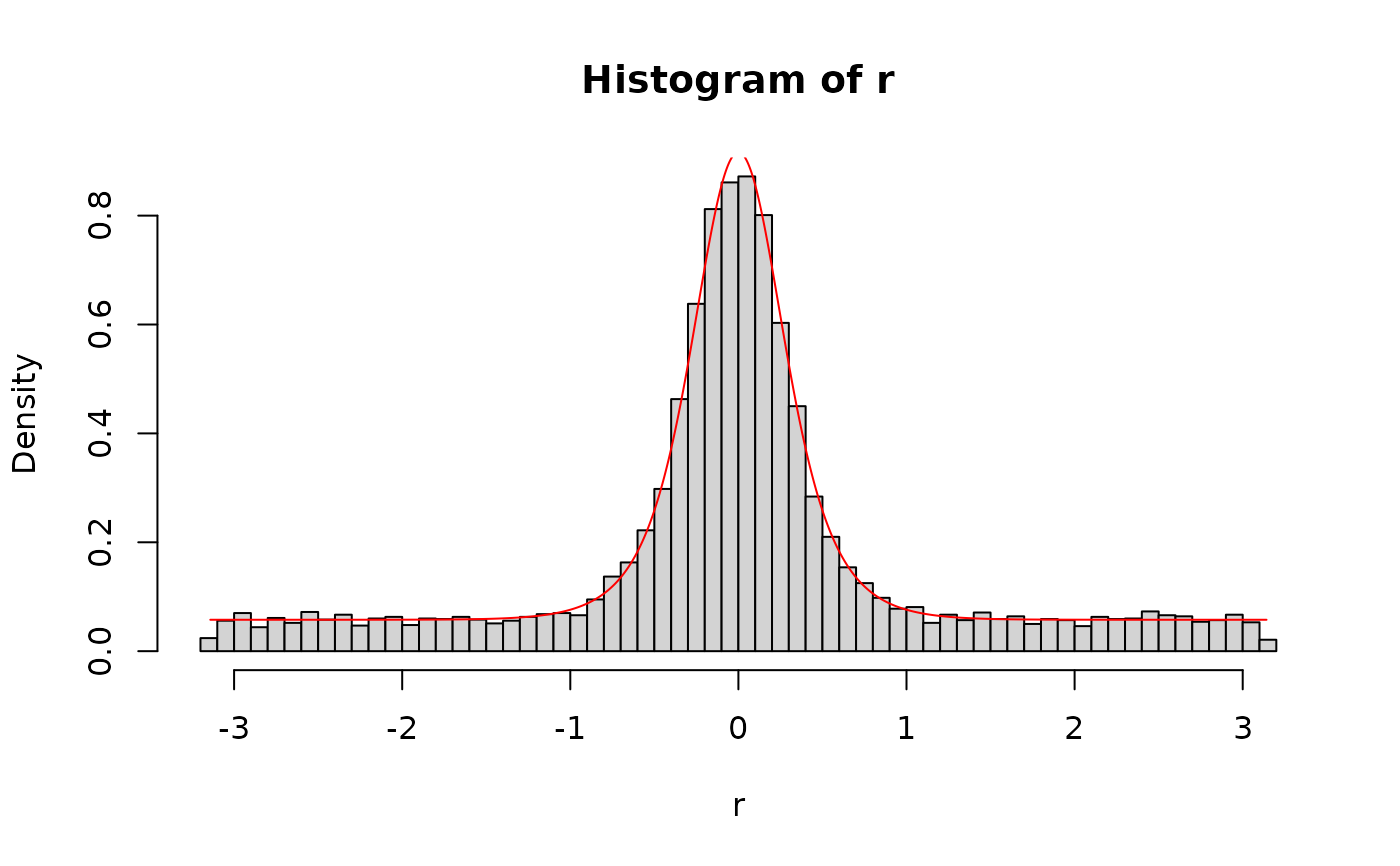
 # generate random deviates from the SDM distribution and overlay the density
r <- rsdm(10000, mu = 0, c = 3.1, kappa = 5)
d <- dsdm(x, mu = 0, c = 3.1, kappa = 5)
hist(r, breaks = 60, freq = FALSE)
lines(x, d, type = "l", col = "red")