Distribution functions for the Interference Measurement Model (IMM)
Source:R/distributions.R
IMMdist.RdDensity, distribution, and random generation functions for the
interference measurement model with the location of mu, strength of cue-
dependent activation c, strength of cue-independent activation a, the
generalization gradient s, and the precision of memory representations
kappa.
Usage
dimm(
  x,
  mu = c(0, 2, -1.5),
  dist = c(0, 0.5, 2),
  c = 5,
  a = 2,
  b = 1,
  s = 2,
  kappa = 5,
  tau = 0,
  vp_nodes = 81L,
  log = FALSE
)

pimm(
  q,
  mu = c(0, 2, -1.5),
  dist = c(0, 0.5, 2),
  c = 1,
  a = 0.2,
  b = 0,
  s = 2,
  kappa = 5
)

qimm(
  p,
  mu = c(0, 2, -1.5),
  dist = c(0, 0.5, 2),
  c = 1,
  a = 0.2,
  b = 0,
  s = 2,
  kappa = 5
)

rimm(
  n,
  mu = c(0, 2, -1.5),
  dist = c(0, 0.5, 2),
  c = 1,
  a = 0.2,
  b = 1,
  s = 2,
  kappa = 5,
  tau = 0
)
Arguments
- x
Vector of observed responses
- mu
Vector of locations
- dist
Vector of distances of the item locations to the cued location
- c
Vector of strengths for cue-dependent activation
- a
Vector of strengths for cue-independent activation
- b
Vector of baseline activation
- s
Vector of generalization gradients
- kappa
Vector of precision values. With
tau > 0this is the concentration of the average trial, whose Fisher informationJ(kappa)is the mean ofJ.- tau
Vector of scales for trial-to-trial variability in precision. The Fisher information
Jof a memory representation is drawn fromgamma(mean = J(kappa), scale = tau).tau = 0, the default, is constant precision. Seeimm().- vp_nodes
Number of quadrature nodes used when
tau > 0; must be an odd number of at least 41. Seemixture2p(). The random generation function needs no nodes: it drawsJfrom its gamma distribution and then the response, which is exact.- log
Logical; if
TRUE, values are returned on the log scale. Pass it by name: in bmm 1.4 it was the ninth argument, which is nowtau. Until bmm 1.6.0 a logical value in that position is still read aslog, with a warning.- q
Vector of quantiles
- p
Vector of probability
- n
Number of observations to generate data for
Value
dimm gives the density of the interference measurement model,
pimm gives the cumulative distribution function of the interference
measurement model, qimm gives the quantile function of the interference
measurement model, and rimm gives the random generation function for the
interference measurement model.
References
Oberauer, K., Stoneking, C., Wabersich, D., & Lin, H.-Y. (2017). Hierarchical Bayesian measurement models for continuous reproduction of visual features from working memory. Journal of Vision, 17(5), 11.
van den Berg, R., Shin, H., Chou, W.-C., George, R., & Ma, W. J. (2012). Variability in encoding precision accounts for visual short-term memory limitations. PNAS, 109(22), 8780-8785.
Examples
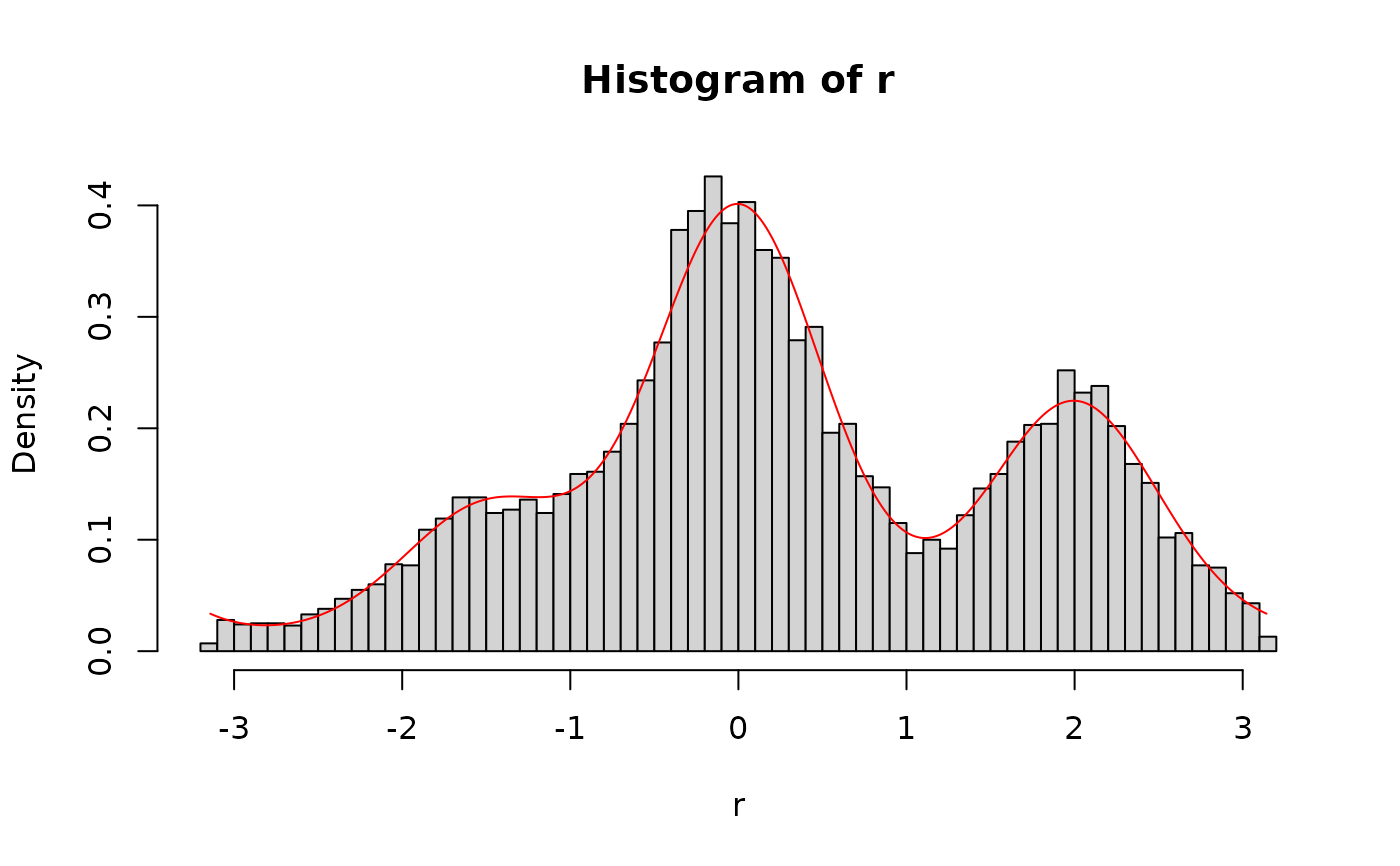
# generate random samples from the imm and overlay the density
r <- rimm(10000,
  mu = c(0, 2, -1.5), dist = c(0, 0.5, 2),
  c = 5, a = 2, s = 2, b = 1, kappa = 4
)
x <- seq(-pi, pi, length.out = 10000)
d <- dimm(x,
  mu = c(0, 2, -1.5), dist = c(0, 0.5, 2),
  c = 5, a = 2, s = 2, b = 1, kappa = 4
)
hist(r, breaks = 60, freq = FALSE)
lines(x, d, type = "l", col = "red")